Not long ago Brandon, a reputable headhunter from UK, asked me point-blank: “Do you know Rust?” Well, since 1993 I’ve written code in BASIC, CLIPPER, PASCAL, SQL, C, PostScript (yes, the stack-oriented beast), TEX, Intel and MIPS assembly, PHP, Java, Matlab, R, Julia, Maple, Maxima, Fortran, C#, Go, Ruby, grammar parsers like LEX and YACC, then of course JavaScript and Python — and my personal favourite: C++ metaprogramming. In other words: if it’s Turing-complete and vaguely hostile to human beings, chances are I’ve built something in it. So no, it’s not the language that matters, it’s the craft. But since Rust is today’s poster child for systems programming, I wrote IEX-DOWNLOAD entirely in Rust. My way of saying: sure, I can do that too, and I’ll even enjoy the borrow checker while I’m at it.
Key Differences (TOPS vs DEEP vs DEEP+)
Feature
TOPS (Top-of-book)
DEEP (Aggregated)
DEEP+ (Order-by-order)
Order granularity
Only best bid/ask + last trade
Aggregated by price level (size summed)
Individual orders (each displayed order)
OrderID / update per order
Not present
Not present
Present
Hidden / non-display / reserve portions
Not shown
Not shown
Not shown
Memory / bandwidth load
Lowest (very compact, minimal updates)
Lower (fewer messages, coarser updates)
Higher (tracking many individual orders, cancels, modifications)
Because it lets you grab over 13 TB of IEX tick data in one shot. Wait, wasn’t it 6 TB last week? Exactly. Trading data is like an iceberg: TOPS shows you the shiny tip (best bid/ask and last trade), while the real bulk is hidden underneath in DEEP and DEEP+. That’s where the weight lives — and where the fun begins.
Progress bar with attitude → because watching terabytes flow should feel satisfying.
PEG-based date parser → type 2025-01-?? or 202{4,5}-{04,05}-?? and it just works, no regex headaches.
One tiny ELF → a single 3.5 MB executable (-rwxrwxr-x 2 steven steven 3.5M Sep 23 11:00 target/release/iex-download).
No Python venvs, no dependency jungles. Drop it anywhere, chmod +x, and let it rip.
DEEP → richer, aggregated depth (enough for most analytics).
DEEP+ (DPLS) → the full microstructure playground (every displayed order).
And that’s the trick: IEX-DOWNLOAD gets you the firehose, and IEX2H5
turns that torrent into tidy, high-performance HDF5 files.
So there you have it: IEX-DOWNLOAD, 4,597 files and 13.26 TB of market microstructure, distilled into a 3.5 MB Rust binary. And to Brandon — thank you for asking the right question. Sometimes all it takes is a good headhunter’s nudge to turn an idea into a tool. Rust may be the new kid, but in the right hands it can move mountains… or at least download a few terabytes before lunch.
What if you could replay the last 9 years of market activity — every quote, every trade — and figure out which stocks have never left the party?
Last Friday, a quiet challenge came up in a conversation. Someone with a sharp mathematical mind and a preference for staying behind the scenes posed a deceptively simple question: "Which stocks have been traded the most, consistently, from 2016 to today?"That one question sent me down a 27-hour rabbit hole…
We had the data: 6TB of IEX tick captures spanning 2'187 PCAP files and over 22'119 unique symbols. We had the tools: an HDF5-backed firehose built for high-frequency analytics in pure C++23.
What followed was a misadventure in semantics. I first averaged trade counts across all dates — a rookie mistake. Turns out, averaging doesn’t guarantee consistency — some stocks burn bright for a while, then disappear. That oversight cost me half a day of CPU time and a good chunk of humility.
The fix? A better idea: walk backwards from today and look for the longest uninterrupted streak of trading activity for each stock.
Luckily, the 12 hours spent building the index weren’t wasted — that heavy lifting could be recycled for the new logic.
Implementation time? 30 minutes. Execution time? 5 seconds. Victory? Priceless.
Before we can rank stocks, we need summary statistics from the raw IEX market data feeds. That’s where iex2h5 comes in — a high-performance HDF5-based data converter purpose-built for handling PCAP dumps from IEX.
To extract stats only (and skip writing any tick data), we use the --command none mode. We'll name the output file something meaningful like statistics.h5, and pass in a file glob — the glorious Unix-era invention (from B at Bell Labs) — pointing to our compressed dataset, e.g. /lake/iex/tops/*.pcap.gz.
Of course, we’re all lazy, so let’s use the short forms -c, -o, and let iex2h5 do its thing:
/trading_days → the full trading calendar (2,187 days)
/stats → per-symbol statistics across all days (e.g. trade volume, trade count, first/last seen)
On the performance side:
Raw storage throughput (ZFS): ~254 MB/s
End-to-end pipeline throughput: 5.76 TB of compressed PCAP input in 44,087 s → ~130 MB/s effective
Event rate: ~5.9 million ticks/sec sustained
From here you’re ready to rank, filter, and extract the top performers. The best part? A full 6 TB dataset was processed in ~12 hours — on a single desktop workstation, using a single-threaded execution model. No cluster, no parallel jobs.
These results form a solid baseline: the upcoming commercial version will extend the engine to a multi-process, multi-threaded execution model, scaling performance well beyond what a single core can deliver.
Step 2 — digest the statistics Top-K Trade Streak Filter for Julia
#!/usr/bin/env python3importnumpyasnpimporth5pyfrompathlibimportPathbase=Path.home()/"scratch"input_file=base/"index.h5"output_file=base/"top30.h5"cutoff_limit,lower_bound=30,50_000fd=h5py.File(input_file,"r",swmr=True)deftrailing_streak(x:np.ndarray,min_val:float)->int:cnt=0forvinx[::-1]:ifv>min_val:cnt+=1else:breakreturncntdates=fd["/trading_days.txt"][:].astype(str)instruments=fd["/instruments.txt"][:].astype(str)D,I=len(dates),len(instruments)A=np.zeros((D,I),dtype=np.float64)forday,dateinenumerate(dates):path=f"/stats/{date}/trade_size"ifpathinfd:count=np.asarray(fd[path][()]).ravel()n=min(I,count.size)A[day,:n]=count[:n]# Step 2: Compute trailing streak length for each instrumentstreak_lengths=np.array([trailing_streak(A[:,i],lower_bound)foriinrange(A.shape[1])])# Step 3: Rank instruments by streak length# DO NOT USE: it is not a stable sort, will diverge from julia implementation# order = np.argsort(-streak_lengths) order=np.lexsort((np.arange(len(streak_lengths)),-streak_lengths))selection=order[:cutoff_limit]h5_instruments=instruments[selection]h5_trading_days=dates[-streak_lengths[selection].min():]# Step 4: write resultstr_dtype=h5py.string_dtype(encoding="utf-8")withh5py.File(output_file,"w")asfd_out:fd_out.create_dataset("/instruments.txt",data=h5_instruments.astype(object),dtype=str_dtype)fd_out.create_dataset("/trading_days.txt",data=h5_trading_days.astype(object),dtype=str_dtype)
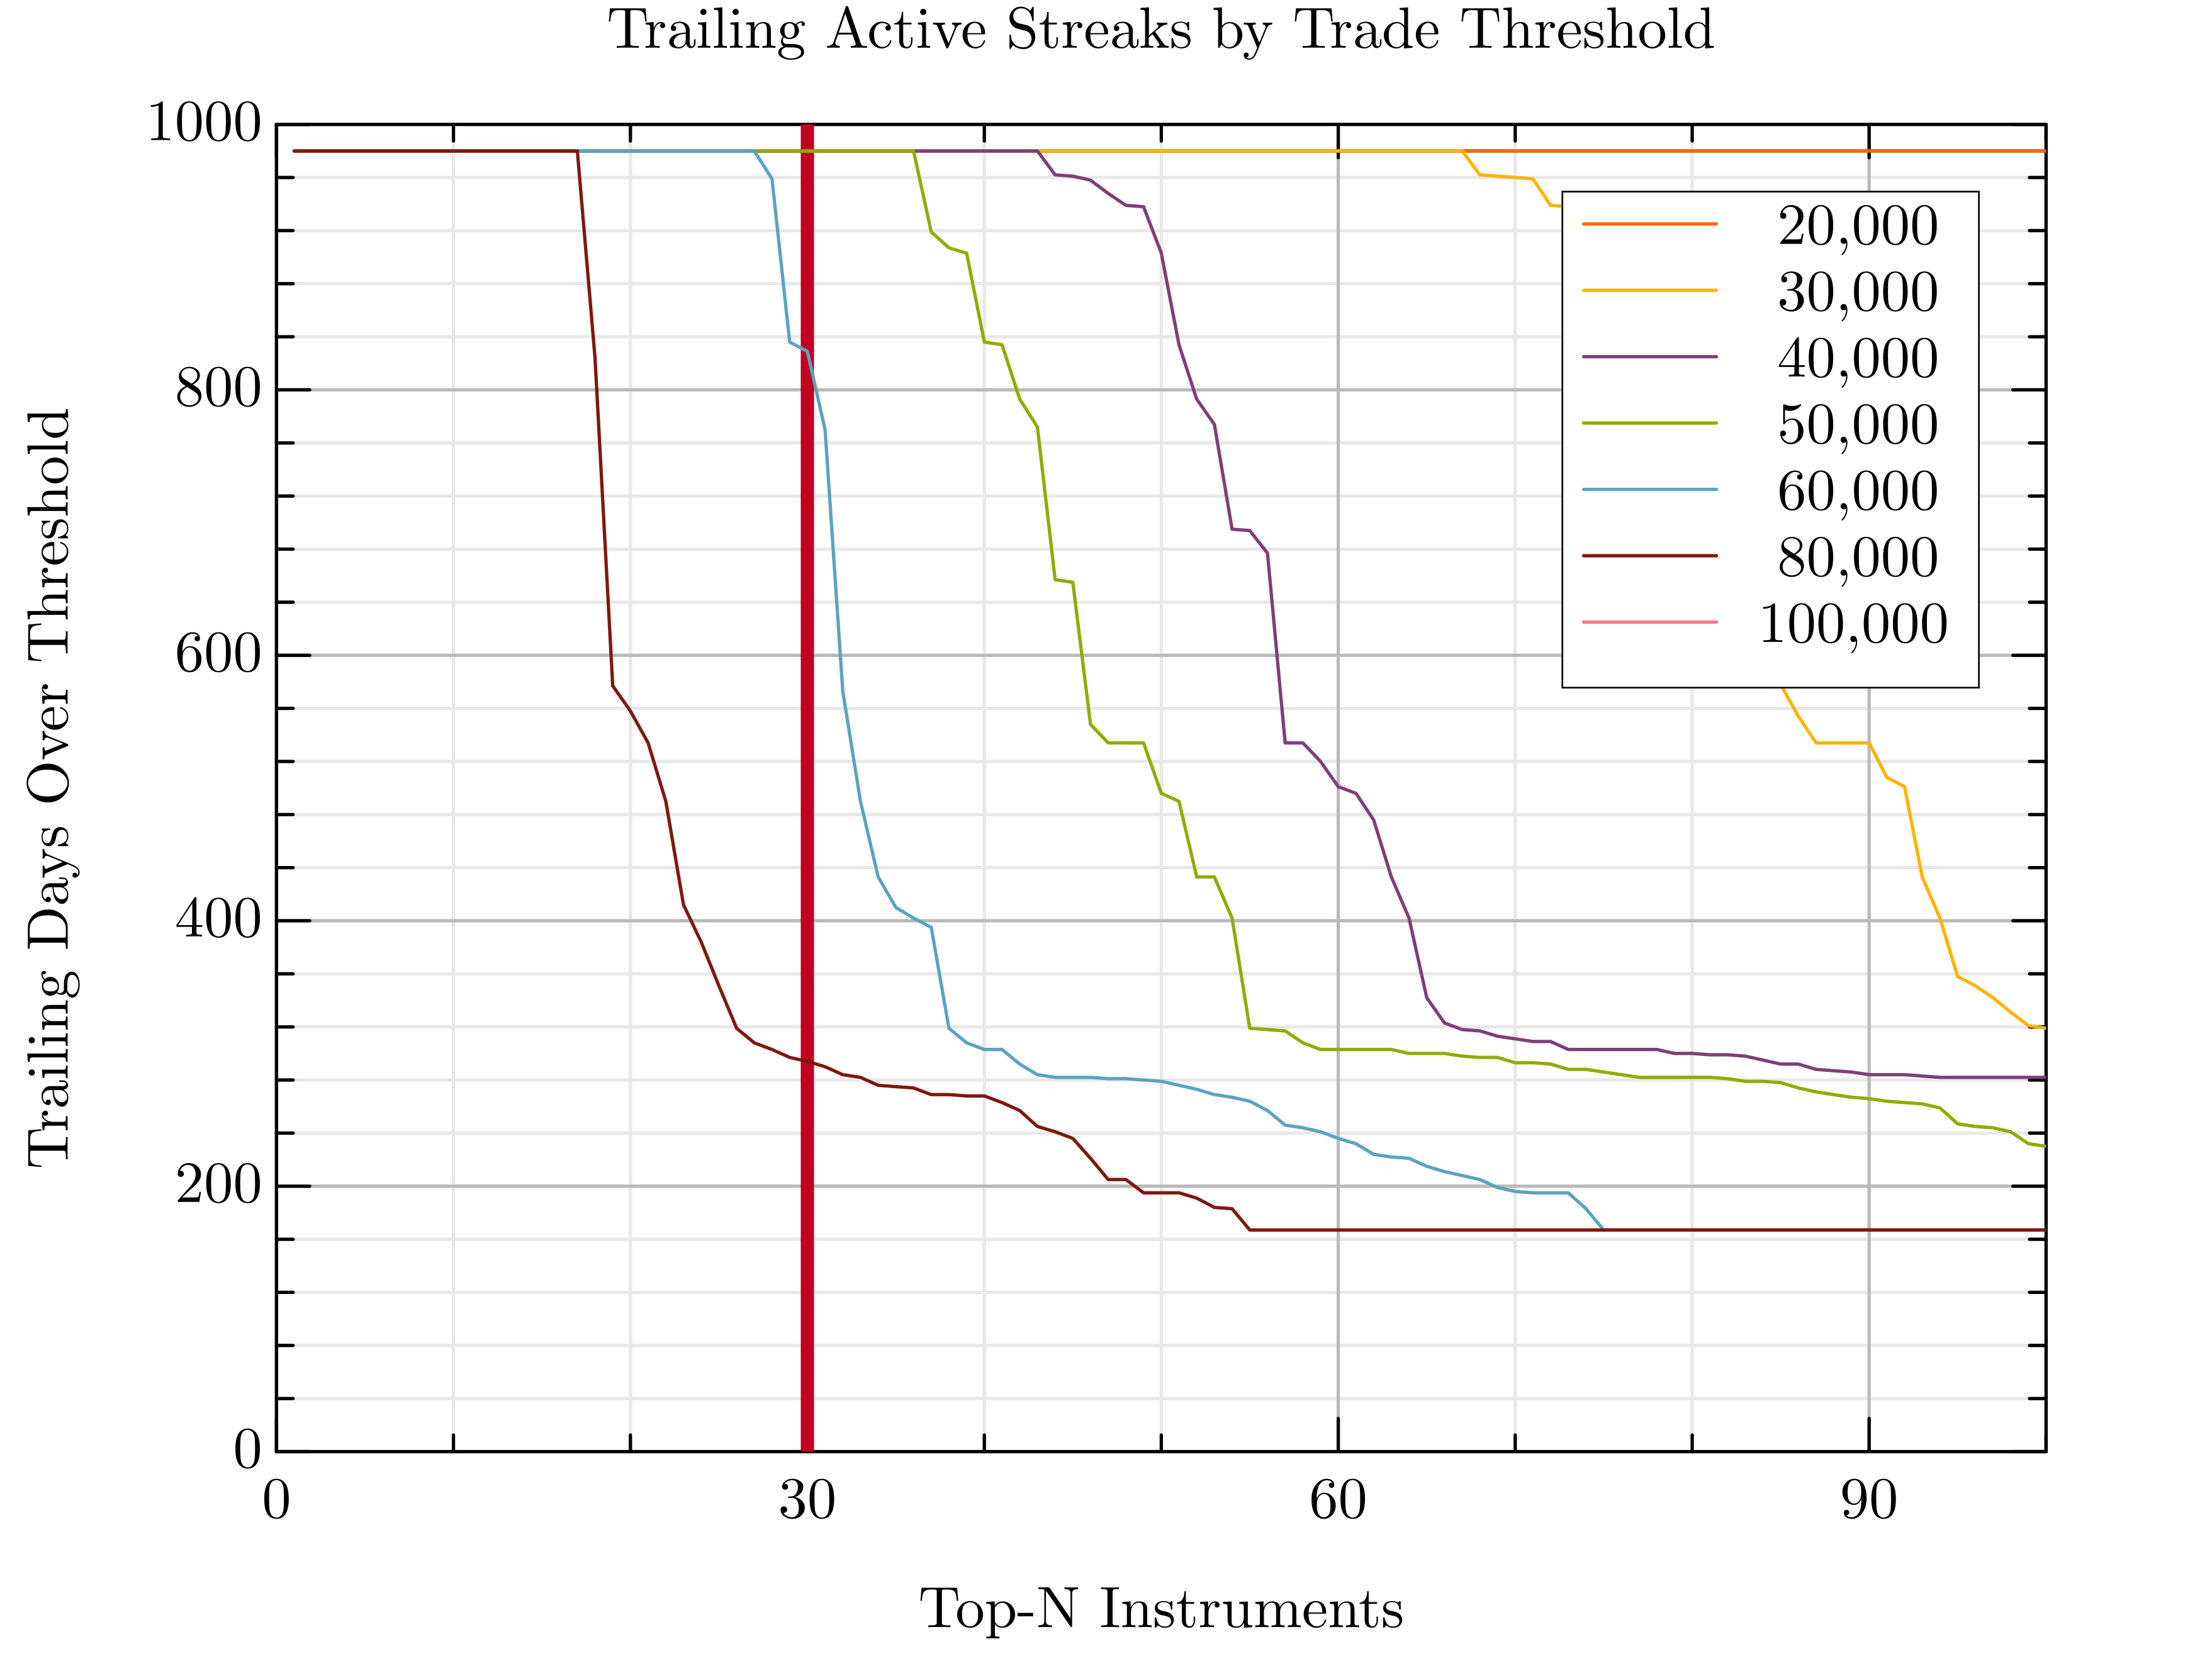
usingPrintf,FormatimportGRUtils:oplot,plot,legend,xlabel,ylabel,title,savefigcolorscheme("solarized light")thresholds=[20_000,30_000,40_000,50_000,60_000,80_000,100_000]cutoff_limit,max=30,100compute_streaks(A,min_val)=[trailing_streak(A[:,i],min_val)foriin1:size(A,2)]sorted_streaks_per_threshold=Dict()fortinthresholdsstreaks=compute_streaks(A,t)sorted_streaks_per_threshold[t]=sort(streaks,rev=true)[1:max]endplot([cutoff_limit,cutoff_limit],[0,1000],"-r";linewidth=4,linestyle=:dash,xlim=(0,max),xticks=(10,3),label=" 30")fortinthresholds[1:end]oplot(1:length(sorted_streaks_per_threshold[t]),sorted_streaks_per_threshold[t];label=format("{:>8}",format(t,commas=true)),lw=2)endlegend("")xlabel("Top-N Instruments")ylabel("Trailing Days Over Threshold")title("Trailing Active Streaks by Trade Threshold")
Step 3 — Reprocess the Tick Data for the Top 30 Stocks
Now that we’ve identified the most consistently active stocks, it’s time to zoom in and reprocess just the relevant PCAP files. If you already have tick-level HDF5 output, you’re set. But if not, here's a neat trick: use good old Unix GLOB patterns to cherry-pick just the days you need — no need to touch all 6TB again.
For example, let’s reconstruct a trading window around September 2021:
iex2h5-cirts-otop30.h5/lake/iex/tops/TOPS-2021-09-1{3,4,5,6,7,8,9}.pcap.gz# fractional startiex2h5-cirts-otop30.h5/lake/iex/tops/TOPS-2021-09-{2,3}?.pcap.gz# rest of the month
And then stitch together additional months or years:
These globs target specific slices of the timeline while keeping file-level parallelism open for future optimization. And of course, you can always batch them via xargs.
As this series of experiments suggests, there’s more to large-scale market data processing than meets the eye. It’s tempting to think of backtesting as a clean, deterministic pipeline — but in practice, the data fights back.
You’ll encounter missing or corrupted captures, incomplete trading days, symbols that appear midstream, and others that vanish without warning. Stocks get halted, merged, delisted, or IPO mid-cycle — all of which silently affect continuity, volume, and strategy logic.
Even more subtly, corporate actions like stock splits can distort price series unless explicitly accounted for. For example, Nvidia’s 10-for-1 stock split on June 7, 2024, caused a sudden drop in share price purely due to adjustment — not market dynamics. Without proper normalization, strategies can misinterpret these events as volatility or crashes.
Even a simple idea like “find the most consistently traded stocks” turns out to depend on how you define consistency, and how well you understand the structure of your own dataset.
 Last Friday, a quiet challenge came up in a conversation. Someone with a sharp mathematical mind and a preference for staying behind the scenes posed a deceptively simple question: "Which stocks have been traded the most, consistently, from 2016 to today?"
That one question sent me down a 27-hour rabbit hole…
Last Friday, a quiet challenge came up in a conversation. Someone with a sharp mathematical mind and a preference for staying behind the scenes posed a deceptively simple question: "Which stocks have been traded the most, consistently, from 2016 to today?"
That one question sent me down a 27-hour rabbit hole… As this series of experiments suggests, there’s more to large-scale market data processing than meets the eye. It’s tempting to think of backtesting as a clean, deterministic pipeline — but in practice, the data fights back.
You’ll encounter missing or corrupted captures, incomplete trading days, symbols that appear midstream, and others that vanish without warning. Stocks get halted, merged, delisted, or IPO mid-cycle — all of which silently affect continuity, volume, and strategy logic.
Even more subtly, corporate actions like stock splits can distort price series unless explicitly accounted for. For example, Nvidia’s 10-for-1 stock split on June 7, 2024, caused a sudden drop in share price purely due to adjustment — not market dynamics. Without proper normalization, strategies can misinterpret these events as volatility or crashes.
Even a simple idea like “find the most consistently traded stocks” turns out to depend on how you define consistency, and how well you understand the structure of your own dataset.
As this series of experiments suggests, there’s more to large-scale market data processing than meets the eye. It’s tempting to think of backtesting as a clean, deterministic pipeline — but in practice, the data fights back.
You’ll encounter missing or corrupted captures, incomplete trading days, symbols that appear midstream, and others that vanish without warning. Stocks get halted, merged, delisted, or IPO mid-cycle — all of which silently affect continuity, volume, and strategy logic.
Even more subtly, corporate actions like stock splits can distort price series unless explicitly accounted for. For example, Nvidia’s 10-for-1 stock split on June 7, 2024, caused a sudden drop in share price purely due to adjustment — not market dynamics. Without proper normalization, strategies can misinterpret these events as volatility or crashes.
Even a simple idea like “find the most consistently traded stocks” turns out to depend on how you define consistency, and how well you understand the structure of your own dataset.